[C++, Unreal Engine, DevOps] IncrediBuild: How to Speed up Your Project's Build and Analysis
Автор
Сообщение
news_bot ®
Стаж: 8 лет
Сообщений: 27286
"How much longer are you going to build it?" - a phrase that every developer has uttered at least once in the middle of the night. Yes, a build can be long and there is no escaping it. One does not simply redistribute the whole thing among 100+ cores, instead of some pathetic 8-12 ones. Or is it possible? 
I need more cores!As you may have noticed, today's article is about how to speed up compilation as well as static analysis. But what does speeding up compilation have to do with static analysis? It is simple - what boosts compilation also speeds up the analysis. And no, this time we will not talk about any specific solutions, but will instead focus on the most common parallelization. Well, everything here seems to be simple – we specify the physically available number of processor cores, click on the build command and go to drink the proverbial tea.But with the growth of the code base, the compilation time gradually increases. Therefore, one day it will become so large that only the nighttime will remain suitable for building an entire project. That's why we need to think about how to speed up all this. And now imagine - you're sitting surrounded by satisfied colleagues who are busy with their little programming chores. Their machines display some text on their screens, quietly, without any strain on their hardware..."I wish I could take the cores from these idlers..." you might think. It would be right thing to do, as it's rather easy. Please, do not take my words to heart arming yourself with a baseball bat! However, this is at your discretion :)Give it to me!Since it is unlikely that anyone will allow us to commandeer our colleagues' machines, you'll have to go for workarounds. Even if you managed to convince your colleagues to share the hardware, you will still not benefit from the extra processors, except that you can choose the one that is faster. As for us, we need a solution that will somehow allow us to run additional processes on remote machines. Fortunately, among thousands of software categories, the distributed build system that we need has also squeezed in. Programs like these do exactly what we need: they can deliver us the idling cores of our colleagues and, at the same time, do it without their knowledge in automatic mode. Granted, you first need to install all of this on their machines, but more on that later...Who will we test on? In order to make sure that everything is functioning really well, I had to find a high-quality test subject. So I resorted to open source games. Where else would I find large projects? And as you will see below, I really regretted this decision.However, I easily found a large project. I was lucky to stumble upon an open source project on Unreal Engine. Fortunately, IncrediBuild does a great job parallelizing projects on UnrealBuildSystem.So, welcome the main character of this article: Unreal Tournament. But there is no need to hurry and click on the link immediately. You may need a couple of additional clicks, see the details *here*.
Let the 100+ cores build begin!As an example of a distributed build system, I'll opt for IncrediBuild. Not that I had much choice - we already have an IncrediBuild license for 20 machines. There is also an open source distcc, but it's not that so easy to configure. Besides, almost all our machines are on Windows.So, the first step is to install agents on the machines of other developers. There are two ways:
- ask your colleagues via your local Slack;
- appeal to the powers of the system administrator.
Of course, like any other naive person, I first had asked in Slack... After a couple of days, it barely reached 12 machines out of 20. After that, I appealed to the power of the system admin. Lo and behold! I got the coveted twenty! So, at that point I had about 145 cores (+/- 10) :)What I had to do was to install agents (by a couple of clicks in the installer) and a coordinator. This is a bit more complicated, so I'll leave a link to the docs.So now we have a distributed build network on steroids, therefore it's time to get into Visual Studio. Already reaching to a build command?... Not so fast :)If you'd like to try the whole process yourself, keep in mind that you first need to build the ShaderCompileWorker and UnrealLightmass projects. Since they are not large, I built them locally. Now you can click on the coveted button: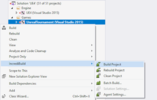
So, what's the difference?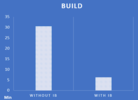
As you can see, we managed to speed up the build from 30 minutes to almost 6! Not bad indeed! By the way, we ran the build in the middle of a working day, so you can expect such figures on a real test as well. However, the difference may vary from project to project.What else are we going to speed up?In addition to the build, you can feed IncrediBuild with any tool that produces a lot of subprocesses. I myself work in PVS-Studio. We are developing a static analyzer called PVS-Studio. Yes, I think you already guessed :) We will pass it to IncrediBuild for parallelization.Quick analysis is as agile as a quick build: we can get local runs before the commit. It's always tempting to upload all of files at once to the master. However, your teamlead may not be happy with such actions, especially when night builds crash on the server... Trust me – I went through that :(The analyzer won't need specific configurations, except we can specify good old 145 analysis threads in the settings:
Well, it is worth showing to the local build system who is the big analyzer here:
Details *here*So, it's time to click on the build again and enjoy the speed boost: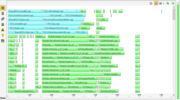
It took about seven minutes, which is suspiciously similar to the build time... At this point I thought I probably forgot to add the flag. But in the Settings screen, nothing was missing... I didn't expect that, so I went to study manuals.Attempt to run PVS-Studio #2After some time, I recalled the Unreal Engine version used in this project:
Not that this is a bad thing in itself, but the support for -StaticAnalyzer flag appeared much later. Therefore, it is not quite possible to integrate analyzer directly. At about this point, I began to think about giving up on the whole thing and having a coffee.After a couple of cups of refreshing drink, I got the idea to finish reading the tutorial on integration of the analyzer to the end. In addition to the above method, there is also the 'compilation monitoring' one. This is the option for when nothing else helps anymore.First of all, we'll enable the monitoring server:
CLMonitor.exe monitor
This thing will run in the background watching for compiler calls. This will give the analyzer all the necessary information to perform the analysis itself. But it can't track what's happening in IncrediBuild (because IncrediBuild distributes processes on different machines, and monitoring works only locally), so we'll have to build it once without it.A local rebuild looks very slow in contrast to a previous run:
Total build time: 1710,84 seconds (Local executor: 1526,25 seconds)
Now let's save what we collected in a separate file:
CLMonitor.exe saveDump -d dump.gz
We can use this dump further until we add or remove files from the project. Yes, it's not as convenient as with direct UE integration through the flag, but there's nothing we can do about it - the engine version is too old.The analysis itself runs by this command:
CLMonitor.exe analyzeFromDump -l UE.plog -d dump.gz
Just do not run it like that, because we want to run it under IncrediBuild. So, let's add this command to analyze.bat. And create a profile.xml file next to it:
<?xml version="1.0" encoding="UTF-8" standalone="no" ?>
<Profile FormatVersion="1">
<Tools>
<Tool Filename="CLMonitor" AllowIntercept="true" />
<Tool Filename="cl" AllowRemote="true" />
<Tool Filename="PVS-Studio" AllowRemote="true" />
</Tools>
</Profile>
Details *here*And now we can run everything with our 145 cores:
ibconsole /command=analyze.bat /profile=profile.xml
This is how it looks in the Build Monitor: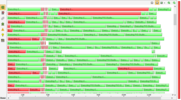
There are a lot of errors on this chart, aren't there? As they say, troubles never come singly. This time, it's not about unsupported features. The way Unreal Tournament build was configured turned out to be somewhat... 'specific'. Attempt to run PVS-Studio #3A closer look reveals that these are not the errors of the analyzer. Rather, a failure of source code preprocessing. The analyzer needs to preprocess your source code first, so it uses the information it 'gathered' from the compiler. Moreover, the reason for this failure was the same for many files:
....\Build.h(42): fatal error C1189: #error: Exactly one of [UE_BUILD_DEBUG \
UE_BUILD_DEVELOPMENT UE_BUILD_TEST UE_BUILD_SHIPPING] should be defined to be 1
So, what's the problem here? It's pretty simple – the preprocessor requires only one of the following macros to have a value of '1':
- UE_BUILD_DEBUG;
- UE_BUILD_DEVELOPMENT;
- UE_BUILD_TEST;
- UE_BUILD_SHIPPING.
At the same time, the build completed successfully, but something really bad happened now. I had to dig into the logs, or rather, the compilation dump. That's where I found the problem. The point was that these macros are declared in the local precompiled header, whereas we only want to preprocess the file. However, the include header that was used to generate the precompiled header is different from the one that is included to the source file! The file that is used to generate the precompiled header is a 'wrapper' around the original header included into the source, and this wrapper contains all of the required macros. So, to circumvent this, I had to add all these macros manually:
#ifdef PVS_STUDIO
#define _DEBUG
#define UE_BUILD_DEVELOPMENT 1
#define WITH_EDITOR 1
#define WITH_ENGINE 1
#define WITH_UNREAL_DEVELOPER_TOOLS 1
#define WITH_PLUGIN_SUPPORT 1
#define UE_BUILD_MINIMAL 1
#define IS_MONOLITHIC 1
#define IS_PROGRAM 1
#define PLATFORM_WINDOWS 1
#endif
The very beginning of the build.h fileAnd with this small solution, we can start the analysis. Moreover, the build will not crash, since we used the special PVS_STUDIO macro, that is declared only for the analysis.So, here are the long-awaited analysis results:
You should agree, that almost 15 minutes instead of two and a half hours is a very notable speed boost. And it's really hard to imagine that you could drink coffee for 2 hours straight in a row, and everyone would be happy about it. But a 15-minute break does not raise any questions. Well, in most cases...As you may have noticed, the analysis was very well fit for a speed up, but this is far from the limit. Merging logs into the final one takes a final couple of minutes, as is evident on the Build Monitor (look at the final, single process). Frankly speaking, it's not the most optimal way – it all happens in one thread, as is currently implemented... So, by optimizing this mechanism in the static analyzer, we could save another couple of minutes. Not that this is critical for local runs, but runs with IncrediBuild could be even more eye-popping...And what do we end up with?In a perfect world, increasing the number of threads by a factor of N would increase the build speed by the same N factor. But we live in a completely different world, so it is worth considering the local load on agents (remote machines), the load and limitations on the network (which must carry the results of the remotely distributed processes), the time to organize all this undertaking, and many more details that are hidden under the hood.However, the speed up is undeniable. For some cases, not only will you be able to run an entire build and analysis once a day, but do it much more often. For example, after each fix or before commits. And now I suggest reviewing how it all looks in a single table:
I had five runs and calculated the average for them. You've seen these figures in the charts :)
===========
Источник:
habr.com
===========
Похожие новости:
- [Тестирование IT-систем, Анализ и проектирование систем, Проектирование и рефакторинг, TDD, Отладка] Почему большинство юнит тестов — пустая трата времени? (перевод статьи) (перевод)
- [JavaScript, Google Chrome, HTML] Швейцарский нож отладки JavaScript
- [Oracle, Программирование, SQL, DevOps] Настройка CI/CD скриптов миграции БД с нуля с использованием GitLab и Liquibase
- [Облачные вычисления, DevOps] Как ускорить работу микросервиса с помощью многопоточности, асинхронности и кэша: пошаговая инструкция
- [PHP, Фриланс, Карьера в IT-индустрии, Бизнес-модели] Сайт сына маминой подруги
- [Amazon Web Services, DevOps, Google Cloud Platform, Kubernetes] Как готовить Helm правильно: несколько полезных рецептов
- [Java, C++, Разработка под Android, C] Производительность Android Runtime vs NDK
- [Git, Системы управления версиями, Системы сборки, DevOps] Вышел релиз GitLab 13.11 с агентом для Kubernetes и настройкой конвейера для проверки соответствия требованиям
- [Системное администрирование, Карьера в IT-индустрии, DevOps, Kubernetes] Как проходит DevOps-стажировка в Southbridge
- [C++] Понимаем красно-черное дерево. Часть 2. Балансировка и вставка
Теги для поиска: #_c++, #_unreal_engine, #_devops, #_pvsstudio, #_incredibuild, #_development, #_tools, #_test, #_research, #_static_analysis, #_unrealengine, #_blog_kompanii_pvsstudio (
Блог компании PVS-Studio
), #_c++, #_unreal_engine, #_devops
Вы не можете начинать темы
Вы не можете отвечать на сообщения
Вы не можете редактировать свои сообщения
Вы не можете удалять свои сообщения
Вы не можете голосовать в опросах
Вы не можете прикреплять файлы к сообщениям
Вы не можете скачивать файлы
Текущее время: 11-Фев 08:41
Часовой пояс: UTC + 5
| Автор | Сообщение |
|---|---|
|
news_bot ®
Стаж: 8 лет |
|
|
"How much longer are you going to build it?" - a phrase that every developer has uttered at least once in the middle of the night. Yes, a build can be long and there is no escaping it. One does not simply redistribute the whole thing among 100+ cores, instead of some pathetic 8-12 ones. Or is it possible?  I need more cores!As you may have noticed, today's article is about how to speed up compilation as well as static analysis. But what does speeding up compilation have to do with static analysis? It is simple - what boosts compilation also speeds up the analysis. And no, this time we will not talk about any specific solutions, but will instead focus on the most common parallelization. Well, everything here seems to be simple – we specify the physically available number of processor cores, click on the build command and go to drink the proverbial tea.But with the growth of the code base, the compilation time gradually increases. Therefore, one day it will become so large that only the nighttime will remain suitable for building an entire project. That's why we need to think about how to speed up all this. And now imagine - you're sitting surrounded by satisfied colleagues who are busy with their little programming chores. Their machines display some text on their screens, quietly, without any strain on their hardware..."I wish I could take the cores from these idlers..." you might think. It would be right thing to do, as it's rather easy. Please, do not take my words to heart arming yourself with a baseball bat! However, this is at your discretion :)Give it to me!Since it is unlikely that anyone will allow us to commandeer our colleagues' machines, you'll have to go for workarounds. Even if you managed to convince your colleagues to share the hardware, you will still not benefit from the extra processors, except that you can choose the one that is faster. As for us, we need a solution that will somehow allow us to run additional processes on remote machines. Fortunately, among thousands of software categories, the distributed build system that we need has also squeezed in. Programs like these do exactly what we need: they can deliver us the idling cores of our colleagues and, at the same time, do it without their knowledge in automatic mode. Granted, you first need to install all of this on their machines, but more on that later...Who will we test on? In order to make sure that everything is functioning really well, I had to find a high-quality test subject. So I resorted to open source games. Where else would I find large projects? And as you will see below, I really regretted this decision.However, I easily found a large project. I was lucky to stumble upon an open source project on Unreal Engine. Fortunately, IncrediBuild does a great job parallelizing projects on UnrealBuildSystem.So, welcome the main character of this article: Unreal Tournament. But there is no need to hurry and click on the link immediately. You may need a couple of additional clicks, see the details *here*.  Let the 100+ cores build begin!As an example of a distributed build system, I'll opt for IncrediBuild. Not that I had much choice - we already have an IncrediBuild license for 20 machines. There is also an open source distcc, but it's not that so easy to configure. Besides, almost all our machines are on Windows.So, the first step is to install agents on the machines of other developers. There are two ways:
 So, what's the difference?  As you can see, we managed to speed up the build from 30 minutes to almost 6! Not bad indeed! By the way, we ran the build in the middle of a working day, so you can expect such figures on a real test as well. However, the difference may vary from project to project.What else are we going to speed up?In addition to the build, you can feed IncrediBuild with any tool that produces a lot of subprocesses. I myself work in PVS-Studio. We are developing a static analyzer called PVS-Studio. Yes, I think you already guessed :) We will pass it to IncrediBuild for parallelization.Quick analysis is as agile as a quick build: we can get local runs before the commit. It's always tempting to upload all of files at once to the master. However, your teamlead may not be happy with such actions, especially when night builds crash on the server... Trust me – I went through that :(The analyzer won't need specific configurations, except we can specify good old 145 analysis threads in the settings:  Well, it is worth showing to the local build system who is the big analyzer here:  Details *here*So, it's time to click on the build again and enjoy the speed boost:  It took about seven minutes, which is suspiciously similar to the build time... At this point I thought I probably forgot to add the flag. But in the Settings screen, nothing was missing... I didn't expect that, so I went to study manuals.Attempt to run PVS-Studio #2After some time, I recalled the Unreal Engine version used in this project:  Not that this is a bad thing in itself, but the support for -StaticAnalyzer flag appeared much later. Therefore, it is not quite possible to integrate analyzer directly. At about this point, I began to think about giving up on the whole thing and having a coffee.After a couple of cups of refreshing drink, I got the idea to finish reading the tutorial on integration of the analyzer to the end. In addition to the above method, there is also the 'compilation monitoring' one. This is the option for when nothing else helps anymore.First of all, we'll enable the monitoring server: CLMonitor.exe monitor
Total build time: 1710,84 seconds (Local executor: 1526,25 seconds)
CLMonitor.exe saveDump -d dump.gz
CLMonitor.exe analyzeFromDump -l UE.plog -d dump.gz
<?xml version="1.0" encoding="UTF-8" standalone="no" ?>
<Profile FormatVersion="1"> <Tools> <Tool Filename="CLMonitor" AllowIntercept="true" /> <Tool Filename="cl" AllowRemote="true" /> <Tool Filename="PVS-Studio" AllowRemote="true" /> </Tools> </Profile> ibconsole /command=analyze.bat /profile=profile.xml
 There are a lot of errors on this chart, aren't there? As they say, troubles never come singly. This time, it's not about unsupported features. The way Unreal Tournament build was configured turned out to be somewhat... 'specific'. Attempt to run PVS-Studio #3A closer look reveals that these are not the errors of the analyzer. Rather, a failure of source code preprocessing. The analyzer needs to preprocess your source code first, so it uses the information it 'gathered' from the compiler. Moreover, the reason for this failure was the same for many files: ....\Build.h(42): fatal error C1189: #error: Exactly one of [UE_BUILD_DEBUG \
UE_BUILD_DEVELOPMENT UE_BUILD_TEST UE_BUILD_SHIPPING] should be defined to be 1
#ifdef PVS_STUDIO
#define _DEBUG #define UE_BUILD_DEVELOPMENT 1 #define WITH_EDITOR 1 #define WITH_ENGINE 1 #define WITH_UNREAL_DEVELOPER_TOOLS 1 #define WITH_PLUGIN_SUPPORT 1 #define UE_BUILD_MINIMAL 1 #define IS_MONOLITHIC 1 #define IS_PROGRAM 1 #define PLATFORM_WINDOWS 1 #endif  You should agree, that almost 15 minutes instead of two and a half hours is a very notable speed boost. And it's really hard to imagine that you could drink coffee for 2 hours straight in a row, and everyone would be happy about it. But a 15-minute break does not raise any questions. Well, in most cases...As you may have noticed, the analysis was very well fit for a speed up, but this is far from the limit. Merging logs into the final one takes a final couple of minutes, as is evident on the Build Monitor (look at the final, single process). Frankly speaking, it's not the most optimal way – it all happens in one thread, as is currently implemented... So, by optimizing this mechanism in the static analyzer, we could save another couple of minutes. Not that this is critical for local runs, but runs with IncrediBuild could be even more eye-popping...And what do we end up with?In a perfect world, increasing the number of threads by a factor of N would increase the build speed by the same N factor. But we live in a completely different world, so it is worth considering the local load on agents (remote machines), the load and limitations on the network (which must carry the results of the remotely distributed processes), the time to organize all this undertaking, and many more details that are hidden under the hood.However, the speed up is undeniable. For some cases, not only will you be able to run an entire build and analysis once a day, but do it much more often. For example, after each fix or before commits. And now I suggest reviewing how it all looks in a single table:  I had five runs and calculated the average for them. You've seen these figures in the charts :) =========== Источник: habr.com =========== Похожие новости:
Блог компании PVS-Studio ), #_c++, #_unreal_engine, #_devops |
|
Вы не можете начинать темы
Вы не можете отвечать на сообщения
Вы не можете редактировать свои сообщения
Вы не можете удалять свои сообщения
Вы не можете голосовать в опросах
Вы не можете прикреплять файлы к сообщениям
Вы не можете скачивать файлы
Вы не можете отвечать на сообщения
Вы не можете редактировать свои сообщения
Вы не можете удалять свои сообщения
Вы не можете голосовать в опросах
Вы не можете прикреплять файлы к сообщениям
Вы не можете скачивать файлы
Текущее время: 11-Фев 08:41
Часовой пояс: UTC + 5
