[Программирование, Отладка, Go, DevOps] Monitoring your application with distributed tracing so you actually know what it's doing
Автор
Сообщение
news_bot ®
Стаж: 7 лет 11 месяцев
Сообщений: 27286
What is distributed tracing? Distributed tracing is a method used to profile and monitor applications, especially those built using a microservices architecture. Distributed tracing helps pinpoint where failures occur and what causes poor performance.Let’s have a look at a simple prototype. A user fetches information about a shipment from logisticservice. logisticservice does some computation and fetches the data from a database. logistic service doesn’t know the actual status of the shipment, so it has to fetch the updated status from another service tracking trackingservice also needs to fetch the data from a database and to do some computation.In the screenshot below, we see a whole life cycle of the request issued to logisticsservice: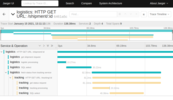
- GET request hits endpoint /shipment/:idin the service logistics
- The service does some internal processing that takes 10 ms (span logistics processing.
- The service fetches data from the database for 30 ms (span SQL select.
- logisticsfetches the status of the shipment from another service tracking by sending a GET request to endpoint /tracking:/:id(span tracking. We have detailed information about this part of the journey as well, i.e. how much time trackingservice used for the processing or how much time the service used for the database operation.
From the screen below, we can see that the request was successful and returned 200. 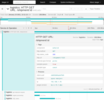
It is especially handy as we didn’t log the response code or created the metadata explicitly: it comes for free from the tracing middleware. Let’s say we want to profile our logistics service. As we can see, we spend most of the time on the database operation. It would be helpful to see the exact query we issued: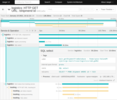
Now we can check whether the query was optimal and which tables it affected. The span contains the information about the caller, including the line number and file name, so it is easy to navigate in the source code.Speaking in general, we can profile any part of the code be it a module or a single function. Such data helps to spot the bottlenecks and make informed decisions about the optimization. Tracing also automatically creates a snapshot of our architecture (DAG):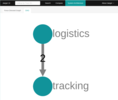
Obviously, the picture above doesn’t look that impressive. But what happens when we have not 2 services, but 30? Let’s say a user logs in and we need to fetch the information from services such as users, settings, billing,etc. In that case, this diagram would be very handy to understand the actual interactions between our services. The tracing would also reveal which of our services takes the most time or which one is the least reliable. Tracing also helps to debug the problems in the microservice architecture. Let’s say each of our microservices is up and behaves well on an individual level. However, we have a problem on a system-wide level. I.e. there is a particular combination of input and output data between the microservices that causes a problem. In that case, individual logs from each of the microservices won’t reveal a problem. We need to tie all the logs from the affected microservices and see the whole picture. Tracing is the right instrument to solve such kind of problems. Distributed Tracing APIsOpenTracingWhat is OpenTracing? It’s a vendor-agnostic API to help developers easily instrument tracing into their codebase. This means that if a developer wants to try out a different distributed tracing system, then instead of repeating the whole instrumentation process for the new distributed tracing system, the developer can simply change the configuration of the Tracer.Most mental models for tracing descend from Google’s Dapper paper. OpenTracing uses similar nouns and verbs (source):
- Trace: The description of a transaction as it moves through a distributed system.
- Span: A named, timed operation representing a piece of the workflow. Spans accept key:value tags as well as fine-grained, timestamped, structured logs attached to the particular span instance.
- Span context: Trace information that accompanies the distributed transaction, including when it passes the service to service over the network or through a message bus. The span context contains the trace identifier, span identifier, and any other data that the tracing system needs to propagate to the downstream service.
There are several tracers that support OpenTracing API, including Jaeger, Instana, and Elastic APM. OpenTelemetryOpenTelemetry is a set of APIs, SDKs, tooling and integrations that are designed for the creation and management of telemetry data such as traces, metrics, and logs. OpenTelemetry is a CNCF Sandbox member, formed through a merger of the OpenTracing and OpenCensus projects.OpenTelemetry implementation for Go is in pre-GA phase. As of today (15.01.2021), the estimated percentage of completion for the first release candidate is 72%.
One of the three main components - logging have not yet been implemented:
As OpenTelemetry implementation in Go hasn’t yet matured, this proposal uses OpenTracing standard. Both standards use the same terminology and concepts, so the migration to newer OpenTelemetry should be relatively straightforward. TracersJaegerThe Jaeger tracing system is an open-source tracing system for microservices, and it supports the OpenTracing standard. Jaeger was initially published as open source by Uber Technologies and has evolved since then. The system gives you distributing tracing, root cause analysis, service dependency analysis, and more.New Relic APMNew Relic APM (Application Performance Monitoring) provides monitoring of application’s performance and has support for distributed tracing.New Relic ATM uses the same terminology as OpenTracing with the addition of transaction. At New Relic, a transaction is defined as one logical unit of work in a software application. Specifically, it refers to the function calls and method calls that make up that unit of work. For APM, it will often refer to a web transaction, which represents an activity that happens from when the application receives a web request to when the response is sent.New Relic APM has support for the instrumentation of Go applications. The API can be found here.New Relic also provides open-source integrations that report telemetry data from telemetry tools to a New Relic account. In particular, it provides an exporter for sending OpenTelemetry data to New Relic. Grafana TempoGrafana Tempo is a tracing backend that implements OpenTelemetry/OpenTracing standards. Here is example instrumentation with opentelementrylibrary.SentrySentry is an application monitoring system with support for distributed tracing. The API can be found here.PrototypePrototype microservices were written in Go and are using OpenTracing API. Service logisticsService logisticsexposes a REST endpoint /shipment/:id.We use echolibrary that has excellent support for the tracing middleware. Note, though, that echois not a hard requirement - it is possible to write our own tracing middleware and achieve the same result.We instantiate a logging middleware that automatically logs a response code and some metadata.
SERVICE = "logistics"
e := echo.New()
os.Setenv("JAEGER_SERVICE_NAME", SERVICE)
// Enable tracing middleware
c := jaegertracing.New(e, nil)
defer c.Close()
Create a simple handler:
e.GET("/shipment/:id", func(c echo.Context) error {
sp := jaegertracing.CreateChildSpan(c, "get shipment request")
defer sp.Finish()
id := c.Param("id")
processing(c, id)
shipment := getShipmentFromDatabase(c, id)
shipment.Status = fetchStatus(c, id)
time.Sleep(time.Millisecond * 15)
return c.JSON(http.StatusOK, shipment)
})
We create the child span spfrom the context. The “span” is the primary building block of a distributed trace, representing an individual unit of work done in a distributed system. Each component of the distributed system contributes a span - a named, timed operation representing a piece of the workflow.After successful processing, we respond with status code 200 and return the shipment information as a JSON.Function processingsimulates some internal processing:
func processing(c echo.Context, id string) {
sp := jaegertracing.CreateChildSpan(c, "logistic processing")
defer sp.Finish()
// simulate the workload
time.Sleep(time.Millisecond * 10)
sp.LogKV("successfully processed shipment", id)
}
In this function, we added a structured logging record by calling sp.LogKV.Function getShipmentFromDatabasesimulates a database operation:
type shipment struct {
ID string
Status string
Carrier string
}
func getShipmentFromDatabase(c echo.Context, id string) shipment {
sp := jaegertracing.CreateChildSpan(c, "SQL select")
defer sp.Finish()
sp.SetTag("sql.query", fmt.Sprintf("SELECT * FROM shipment WHERE id = %s", id))
time.Sleep(time.Millisecond * 30) // simulate a select operation
return shipment{ID: id, Status: "dispatched"}
}
In this function, we added a tag to the span by calling sp.SetTag When should we use a tag and when should we use a logging record? Usually, a tag describes some characteristic that is true during the whole span. While a logging record describes an event that happened at a particular timestamp. Now we have to fetch the status of the shipment from service tracking How do we pass the tracking info across the boundaries between the services? Our GlobalTracersingleton injects the span information into the headers of the request to tracking service:
func fetchStatus(c echo.Context, id string) string {
sp := jaegertracing.CreateChildSpan(c, "fetch status from tracking service")
defer sp.Finish()
url := fmt.Sprintf("http://localhost:8080/tracking/%s", id)
req, err := http.NewRequest(http.MethodGet, url, nil)
if err != nil {
panic(err)
}
opentracing.GlobalTracer().Inject(
sp.Context(),
opentracing.HTTPHeaders,
opentracing.HTTPHeadersCarrier(req.Header))
res, err := http.DefaultClient.Do(req)
if err != nil {
panic(err)
}
defer res.Body.Close()
status, err := ioutil.ReadAll(res.Body)
if err != nil {
panic(err)
}
return string(status)
}
Specifically, the tracer package added the following header to the request to tracking service.
Uber-Trace-Id: 679420a750136ab6:413a9aeeefd2abe8:679420a750136ab6:1
With this information trackingservice is able to continue the trace.Service trackingtrackingservice is quite similar to logisticservice. Here it's full listing:
package main
import (
"fmt"
"io/ioutil"
"net/http"
"os"
"time"
"github.com/labstack/echo-contrib/jaegertracing"
"github.com/labstack/echo/v4"
"github.com/opentracing/opentracing-go"
)
const (
SERVICE = "logistics"
)
func main() {
e := echo.New()
os.Setenv("JAEGER_SERVICE_NAME", SERVICE)
// Enable tracing middleware
c := jaegertracing.New(e, nil)
defer c.Close()
e.GET("/shipment/:id", func(c echo.Context) error {
sp := jaegertracing.CreateChildSpan(c, "get shipment request")
defer sp.Finish()
id := c.Param("id")
processing(c, id)
shipment := getShipmentFromDatabase(c, id)
shipment.Status = fetchStatus(c, id)
time.Sleep(time.Millisecond * 15)
return c.JSON(http.StatusOK, shipment)
})
e.Logger.Fatal(e.Start(":1323"))
}
type shipment struct {
ID string
Status string
Carrier string
}
// simulate some processing
func processing(c echo.Context, id string) {
sp := jaegertracing.CreateChildSpan(c, "logistic processing")
defer sp.Finish()
// simulate the workload
time.Sleep(time.Millisecond * 10)
sp.LogKV("successfully processed shipment", id)
}
// database dependency
func getShipmentFromDatabase(c echo.Context, id string) shipment {
sp := jaegertracing.CreateChildSpan(c, "SQL select")
defer sp.Finish()
sp.SetTag("sql.query", fmt.Sprintf("SELECT * FROM shipment WHERE id = %s", id))
time.Sleep(time.Millisecond * 30) // simulate a select operation
return shipment{ID: id, Status: "dispatched", Carrier: "UPS"}
}
// external dependency: tracking service
func fetchStatus(c echo.Context, id string) string {
sp := jaegertracing.CreateChildSpan(c, "fetch status from tracking service")
defer sp.Finish()
url := fmt.Sprintf("http://localhost:8080/tracking/%s", id)
req, err := http.NewRequest(http.MethodGet, url, nil)
if err != nil {
panic(err)
}
opentracing.GlobalTracer().Inject(
sp.Context(),
opentracing.HTTPHeaders,
opentracing.HTTPHeadersCarrier(req.Header))
res, err := http.DefaultClient.Do(req)
if err != nil {
panic(err)
}
defer res.Body.Close()
status, err := ioutil.ReadAll(res.Body)
if err != nil {
panic(err)
}
return string(status)
}
JaegerWe run an all-in-one Docker container for Jaeger:
jaegar:
docker run -d -p6831:6831/udp -p16686:16686 jaegertracing/all-in-one:latest
Jaeger UI will be accessible on port 16686DemoWe issue a GET request to logisticservice and receive the response:
$ http localhost:1323/shipment/134324 aynur@aynur-manjaro
HTTP/1.1 200 OK
Content-Length: 61
Content-Type: application/json; charset=UTF-8
Date: Fri, 15 Jan 2021 17:54:28 GMT
{
"Carrier": "UPS",
"ID": "134324",
"Status": "dispatched_to_hub"
}
Jaeger UI displays all recorded traces for logistic service: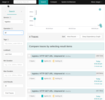
We search a trace for the requested shipment by tag shipment_id (search panel on the right):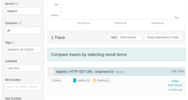
The trace contains in-depth information about the request’s life cycle: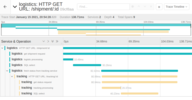
The information can also be represented as a graph:
ConclusionDistributed tracing is a powerful method that used to profile and monitor applications, especially those built using a microservices architecture. As an individual squad doesn’t have too many microservices, the introduction of the tracing would be most beneficial on a company-wide level or at least on a department level.
===========
Источник:
habr.com
===========
Похожие новости:
- [Программирование, Алгоритмы, Go] Algorithms in Go: Merge Intervals
- [Разработка веб-сайтов, JavaScript, Программирование, Алгоритмы, Читальный зал] Библиотека Frontend-разработчика, часть 4: Алгоритмы
- [Программирование, Облачные сервисы, Микросервисы] Введение в паттерн распределенной трассировки (перевод)
- [Веб-дизайн, Разработка веб-сайтов, Тестирование веб-сервисов, Веб-аналитика, Монетизация веб-сервисов] Revealed: 7 Top Web Development Companies & Trends for 2021
- [Разработка веб-сайтов, Google Chrome, Облачные сервисы, DIY или Сделай сам, Processing] Экстренный-психолог в один клик | помощь жертвам насилия
- [Информационная безопасность, Программирование, Java, GitHub, Софт] Architectural approaches to authorization in server applications: Activity-Based Access Control Framework (перевод)
- [Open source, Java, Отладка, Визуализация данных] Новый подход к просмотру логов
- [Программирование, Работа с 3D-графикой, 3D-принтеры, Звук] Флейты, программист и производство
- [Анализ и проектирование систем, IT-инфраструктура, Nginx, Mesh-сети, DevOps] Зачем нужен обратный прокси сервер в 5 актах
- [Open source, Программирование, Go, Управление разработкой] Релиз ruleguard v0.3.0
Теги для поиска: #_programmirovanie (Программирование), #_otladka (Отладка), #_go, #_devops, #_go, #_tracing, #_debug, #_devops, #_development, #_monitoring, #_programmirovanie (
Программирование
), #_otladka (
Отладка
), #_go, #_devops
Вы не можете начинать темы
Вы не можете отвечать на сообщения
Вы не можете редактировать свои сообщения
Вы не можете удалять свои сообщения
Вы не можете голосовать в опросах
Вы не можете прикреплять файлы к сообщениям
Вы не можете скачивать файлы
Текущее время: 15-Янв 10:32
Часовой пояс: UTC + 5
| Автор | Сообщение |
|---|---|
|
news_bot ®
Стаж: 7 лет 11 месяцев |
|
|
What is distributed tracing? Distributed tracing is a method used to profile and monitor applications, especially those built using a microservices architecture. Distributed tracing helps pinpoint where failures occur and what causes poor performance.Let’s have a look at a simple prototype. A user fetches information about a shipment from logisticservice. logisticservice does some computation and fetches the data from a database. logistic service doesn’t know the actual status of the shipment, so it has to fetch the updated status from another service tracking trackingservice also needs to fetch the data from a database and to do some computation.In the screenshot below, we see a whole life cycle of the request issued to logisticsservice: 
 It is especially handy as we didn’t log the response code or created the metadata explicitly: it comes for free from the tracing middleware. Let’s say we want to profile our logistics service. As we can see, we spend most of the time on the database operation. It would be helpful to see the exact query we issued:  Now we can check whether the query was optimal and which tables it affected. The span contains the information about the caller, including the line number and file name, so it is easy to navigate in the source code.Speaking in general, we can profile any part of the code be it a module or a single function. Such data helps to spot the bottlenecks and make informed decisions about the optimization. Tracing also automatically creates a snapshot of our architecture (DAG):  Obviously, the picture above doesn’t look that impressive. But what happens when we have not 2 services, but 30? Let’s say a user logs in and we need to fetch the information from services such as users, settings, billing,etc. In that case, this diagram would be very handy to understand the actual interactions between our services. The tracing would also reveal which of our services takes the most time or which one is the least reliable. Tracing also helps to debug the problems in the microservice architecture. Let’s say each of our microservices is up and behaves well on an individual level. However, we have a problem on a system-wide level. I.e. there is a particular combination of input and output data between the microservices that causes a problem. In that case, individual logs from each of the microservices won’t reveal a problem. We need to tie all the logs from the affected microservices and see the whole picture. Tracing is the right instrument to solve such kind of problems. Distributed Tracing APIsOpenTracingWhat is OpenTracing? It’s a vendor-agnostic API to help developers easily instrument tracing into their codebase. This means that if a developer wants to try out a different distributed tracing system, then instead of repeating the whole instrumentation process for the new distributed tracing system, the developer can simply change the configuration of the Tracer.Most mental models for tracing descend from Google’s Dapper paper. OpenTracing uses similar nouns and verbs (source): 
 One of the three main components - logging have not yet been implemented:  As OpenTelemetry implementation in Go hasn’t yet matured, this proposal uses OpenTracing standard. Both standards use the same terminology and concepts, so the migration to newer OpenTelemetry should be relatively straightforward. TracersJaegerThe Jaeger tracing system is an open-source tracing system for microservices, and it supports the OpenTracing standard. Jaeger was initially published as open source by Uber Technologies and has evolved since then. The system gives you distributing tracing, root cause analysis, service dependency analysis, and more.New Relic APMNew Relic APM (Application Performance Monitoring) provides monitoring of application’s performance and has support for distributed tracing.New Relic ATM uses the same terminology as OpenTracing with the addition of transaction. At New Relic, a transaction is defined as one logical unit of work in a software application. Specifically, it refers to the function calls and method calls that make up that unit of work. For APM, it will often refer to a web transaction, which represents an activity that happens from when the application receives a web request to when the response is sent.New Relic APM has support for the instrumentation of Go applications. The API can be found here.New Relic also provides open-source integrations that report telemetry data from telemetry tools to a New Relic account. In particular, it provides an exporter for sending OpenTelemetry data to New Relic. Grafana TempoGrafana Tempo is a tracing backend that implements OpenTelemetry/OpenTracing standards. Here is example instrumentation with opentelementrylibrary.SentrySentry is an application monitoring system with support for distributed tracing. The API can be found here.PrototypePrototype microservices were written in Go and are using OpenTracing API. Service logisticsService logisticsexposes a REST endpoint /shipment/:id.We use echolibrary that has excellent support for the tracing middleware. Note, though, that echois not a hard requirement - it is possible to write our own tracing middleware and achieve the same result.We instantiate a logging middleware that automatically logs a response code and some metadata. SERVICE = "logistics"
e := echo.New() os.Setenv("JAEGER_SERVICE_NAME", SERVICE) // Enable tracing middleware c := jaegertracing.New(e, nil) defer c.Close() e.GET("/shipment/:id", func(c echo.Context) error {
sp := jaegertracing.CreateChildSpan(c, "get shipment request") defer sp.Finish() id := c.Param("id") processing(c, id) shipment := getShipmentFromDatabase(c, id) shipment.Status = fetchStatus(c, id) time.Sleep(time.Millisecond * 15) return c.JSON(http.StatusOK, shipment) }) func processing(c echo.Context, id string) {
sp := jaegertracing.CreateChildSpan(c, "logistic processing") defer sp.Finish() // simulate the workload time.Sleep(time.Millisecond * 10) sp.LogKV("successfully processed shipment", id) } type shipment struct {
ID string Status string Carrier string } func getShipmentFromDatabase(c echo.Context, id string) shipment { sp := jaegertracing.CreateChildSpan(c, "SQL select") defer sp.Finish() sp.SetTag("sql.query", fmt.Sprintf("SELECT * FROM shipment WHERE id = %s", id)) time.Sleep(time.Millisecond * 30) // simulate a select operation return shipment{ID: id, Status: "dispatched"} } func fetchStatus(c echo.Context, id string) string {
sp := jaegertracing.CreateChildSpan(c, "fetch status from tracking service") defer sp.Finish() url := fmt.Sprintf("http://localhost:8080/tracking/%s", id) req, err := http.NewRequest(http.MethodGet, url, nil) if err != nil { panic(err) } opentracing.GlobalTracer().Inject( sp.Context(), opentracing.HTTPHeaders, opentracing.HTTPHeadersCarrier(req.Header)) res, err := http.DefaultClient.Do(req) if err != nil { panic(err) } defer res.Body.Close() status, err := ioutil.ReadAll(res.Body) if err != nil { panic(err) } return string(status) } Uber-Trace-Id: 679420a750136ab6:413a9aeeefd2abe8:679420a750136ab6:1
package main
import ( "fmt" "io/ioutil" "net/http" "os" "time" "github.com/labstack/echo-contrib/jaegertracing" "github.com/labstack/echo/v4" "github.com/opentracing/opentracing-go" ) const ( SERVICE = "logistics" ) func main() { e := echo.New() os.Setenv("JAEGER_SERVICE_NAME", SERVICE) // Enable tracing middleware c := jaegertracing.New(e, nil) defer c.Close() e.GET("/shipment/:id", func(c echo.Context) error { sp := jaegertracing.CreateChildSpan(c, "get shipment request") defer sp.Finish() id := c.Param("id") processing(c, id) shipment := getShipmentFromDatabase(c, id) shipment.Status = fetchStatus(c, id) time.Sleep(time.Millisecond * 15) return c.JSON(http.StatusOK, shipment) }) e.Logger.Fatal(e.Start(":1323")) } type shipment struct { ID string Status string Carrier string } // simulate some processing func processing(c echo.Context, id string) { sp := jaegertracing.CreateChildSpan(c, "logistic processing") defer sp.Finish() // simulate the workload time.Sleep(time.Millisecond * 10) sp.LogKV("successfully processed shipment", id) } // database dependency func getShipmentFromDatabase(c echo.Context, id string) shipment { sp := jaegertracing.CreateChildSpan(c, "SQL select") defer sp.Finish() sp.SetTag("sql.query", fmt.Sprintf("SELECT * FROM shipment WHERE id = %s", id)) time.Sleep(time.Millisecond * 30) // simulate a select operation return shipment{ID: id, Status: "dispatched", Carrier: "UPS"} } // external dependency: tracking service func fetchStatus(c echo.Context, id string) string { sp := jaegertracing.CreateChildSpan(c, "fetch status from tracking service") defer sp.Finish() url := fmt.Sprintf("http://localhost:8080/tracking/%s", id) req, err := http.NewRequest(http.MethodGet, url, nil) if err != nil { panic(err) } opentracing.GlobalTracer().Inject( sp.Context(), opentracing.HTTPHeaders, opentracing.HTTPHeadersCarrier(req.Header)) res, err := http.DefaultClient.Do(req) if err != nil { panic(err) } defer res.Body.Close() status, err := ioutil.ReadAll(res.Body) if err != nil { panic(err) } return string(status) } jaegar:
docker run -d -p6831:6831/udp -p16686:16686 jaegertracing/all-in-one:latest $ http localhost:1323/shipment/134324 aynur@aynur-manjaro
HTTP/1.1 200 OK Content-Length: 61 Content-Type: application/json; charset=UTF-8 Date: Fri, 15 Jan 2021 17:54:28 GMT { "Carrier": "UPS", "ID": "134324", "Status": "dispatched_to_hub" }  We search a trace for the requested shipment by tag shipment_id (search panel on the right):  The trace contains in-depth information about the request’s life cycle:  The information can also be represented as a graph:  ConclusionDistributed tracing is a powerful method that used to profile and monitor applications, especially those built using a microservices architecture. As an individual squad doesn’t have too many microservices, the introduction of the tracing would be most beneficial on a company-wide level or at least on a department level. =========== Источник: habr.com =========== Похожие новости:
Программирование ), #_otladka ( Отладка ), #_go, #_devops |
|
Вы не можете начинать темы
Вы не можете отвечать на сообщения
Вы не можете редактировать свои сообщения
Вы не можете удалять свои сообщения
Вы не можете голосовать в опросах
Вы не можете прикреплять файлы к сообщениям
Вы не можете скачивать файлы
Вы не можете отвечать на сообщения
Вы не можете редактировать свои сообщения
Вы не можете удалять свои сообщения
Вы не можете голосовать в опросах
Вы не можете прикреплять файлы к сообщениям
Вы не можете скачивать файлы
Текущее время: 15-Янв 10:32
Часовой пояс: UTC + 5
