[Программирование, Go, DevOps] Prometheus in Action: from default counters to SLO-related queries
Автор
Сообщение
news_bot ®
Стаж: 7 лет 10 месяцев
Сообщений: 27286
A Gentle Intro
All Prometheus metrics are based on time series - streams of timestamped values belonging to the same metric. Each time series is uniquely identified by its metric name and optional key-value pairs called labels. The metric name specifies some characteristics of the measured system, such as http_requests_total - the total number of received HTTP requests. In practice, you often will be interested in some subset of the values of a metric, for example, in the number of requests received by a particular endpoint; and here is where the labels come in handy. We can partition a metric by adding endpoint label and see the statics for a particular endpoint: http_requests_total{endpoint="api/status"}. Every metric has two automatically created labels: job_name and instance. We see their roles in the next section.Prometheus provides a functional query language called PromQL. The result of the query might be evaluated to one of four types:
- Scalar (aka float)
- String (currently unused)
- Instant Vector - a set of time series that have exactly one value per timestamp.
- Range Vector - a set of time series that have a range of values between two timestamps.
At first glance, Instant Vector might look like an array, and Range Vector as a matrix.
If that would be the case, then a Range Vector for a single time series "downgrades" to an Instant Vector. However, that's not the case: the difference between a Range Vector and an Instant Vector is not in the number of tracked time series but in the relation between a value of the metric and the corresponding timestamp. In Instant Vector a time series has a single value at the timestamp, in Range Vector a time series has an arbitrary number of values between two timestamps. Therefore, we can more accurately visualize a Range Vector in the following form:
The difference between an instant vector and a range vector will be more clearly seen in the action: let's instrument a Go application and see how can Prometheus help us with insights.A Counter is a metric that only goes up, for example, a number of the incoming HTTP requests.A Gauge is a metric that can have an arbitrary float value, for example, current CPU usage.A Histogram summarizes observations into statistical buckets, for example, we can track an API's response times. Why would one need a histogram and can't just measure the average response time? This is because we are not always interested in the average response times only. Let's say we have an SLO and 95% of the requests should take no longer than 300 ms. We need to single out all requests that took 300 ms or less, count their amount, and divide it by the total number of the request. To do so in Prometheus, we configure a histogram to have a bucket with an upper limit of 0.3 seconds for a response. Later we see how can we configure an alert if we fail to comply with the SLO.There is also a Summary, however it is left mostly for historical reasons and serves the same purpose as a histogram.Instrumenting a Go applicationLet's start without a Prometheus server.
package main
import (
"net/http"
"github.com/prometheus/client_golang/prometheus/promhttp"
)
func main() {
http.Handle("/metrics", promhttp.Handler())
http.ListenAndServe(":2112", nil)
}
promhttp.Handler returns an http.Handler which is already instrumented with the default metrics. Let's see what we get right out of the box by issuing a GET request to the /metrics endpoint.
http localhost:2112/metrics
# HELP go_gc_duration_seconds A summary of the pause duration of garbage collection cycles.
# TYPE go_gc_duration_seconds summary
go_gc_duration_seconds{quantile="0"} 0
go_gc_duration_seconds{quantile="0.25"} 0
go_gc_duration_seconds{quantile="0.5"} 0
go_gc_duration_seconds{quantile="0.75"} 0
go_gc_duration_seconds{quantile="1"} 0
go_gc_duration_seconds_sum 0
go_gc_duration_seconds_count 0
# HELP go_goroutines Number of goroutines that currently exist.
# TYPE go_goroutines gauge
go_goroutines 8
# HELP go_info Information about the Go environment.
# TYPE go_info gauge
go_info{version="go1.15.5"} 1
# HELP go_memstats_alloc_bytes Number of bytes allocated and still in use.
# TYPE go_memstats_alloc_bytes gauge
[truncated]
As we can see we have a rather impressive list of metrics of all types: counters, gauges, and summaries. One of particular interest is a gauge for currently existing goroutines:
# HELP go_goroutines Number of goroutines that currently exist.
# TYPE go_goroutines gauge
go_goroutines 7
Note, that it is the number of existing goroutines, but not the running ones: some of the goroutines might be in the suspended state. One of the goroutines is our main function; the rest are running helper functions from runtime package, and are responsible for tasks such as garbage collection. Later we see how we can use this metric to reveal potential memory leaks. At the end very end, we see a familiar metric for the received HTTP request with label code.
promhttp_metric_handler_requests_total{code="200"} 1
promhttp_metric_handler_requests_total{code="500"} 0
promhttp_metric_handler_requests_total{code="503"} 0
At the next curl request, the metric will be increased by one.Now, this is already looking promising, but how can we instrument our own code? Let's add a simple metric for the processed orders; as this number can only increase, the counter type is a natural choice.
package main
import (
"net/http"
"time"
"github.com/prometheus/client_golang/prometheus"
"github.com/prometheus/client_golang/prometheus/promauto"
"github.com/prometheus/client_golang/prometheus/promhttp"
)
var counter = promauto.NewCounter(prometheus.CounterOpts{
Name: "orders_processed",
})
func main() {
go func() {
for {
counter.Inc()
// simulate some processing function
time.Sleep(time.Second)
}
}()
http.Handle("/metrics", promhttp.Handler())
http.ListenAndServe(":2112", nil)
}
prometheus package provides metrics data types, and promauto package automates some routine tasks, such as metric registration.Now, we can see how well our processing goes:
http localhost:2112/metrics | grep orders_processed
# HELP orders_processed
# TYPE orders_processed counter
orders_processed 7
If we issue the request again we can verify that the processing is up and running:
# HELP orders_processed
# TYPE orders_processed counter
orders_processed 10
If you have a feeling that these values are not that illuminating, then you are on the right track. Prometheus is a statistical instrument at its core: it is intended to work with the trends, and not with the individual results. Later we see how to get some insights with rate and increase functions. Now, we have already instrumented our application and have not yet run Prometheus itself. Why do we need one? A Prometheus server allows us to aggregate data from several instances of our application. It scrapes our application and collects the values of metrics. Here is a simple Prometheus configuration:
scrape_configs:
- job_name: myapp
scrape_interval: 10s
static_configs:
- targets:
- 127.0.0.1:2112
Prometheus server will scrape our application on port 2112 every 10 seconds and collects the metrics. Let's bind this configuration to a docker container and run a Prometheus server:
docker run \
--network "host" \
-p 9090:9090 \
-v $HOME/GolandProjects/go-learn/prometheus/prometheus.yml:/etc/prometheus/prometheus.yml \
prom/prometheus
Note, that we have to enable networking in host mode: our docker container needs to access metric endpoint in our application which is outside of the docker network. Now we can access Prometheus UI on localhost:9090. Here we can see that we are successfully scraping metrics from our application. 
How many goroutines do we have? In a table view we see the last recorded value:
And in a table view we can see the trend: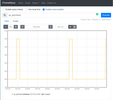
The result of this query (go_goroutines) is an instant vector that contains a single time series. What will be the result for the same query when we run a second instance of our application? Then instance label will have two possible values for two instances, therefore we get two time series. And as noted above we still have an instant vector, not a range vector. Let's add one more target to our configuration and start the second instance of our application at port 21112.
scrape_configs:
- job_name: myapp
scrape_interval: 10s
static_configs:
- targets:
- 127.0.0.1:2112
- 127.0.0.1:21112
Here we can see the number of goroutines for both our instances. 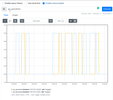
If we provide a time range we get a range vector: 
In this case, we requested a range of values between two timestamps: now and five minutes in the past with a step equal to 1 minute. In the output, symbol @separates a value of a metric from its timestamp.Neither Prometheus no Grafana can picture the graph for a range vector. However, all function that takes a range vector as input returns an instant vector which in turn can be pictured. Prometheus Functions and ModifiersThe two most useful range functions are increase and rate; both of them should be used only with counters. Let's have a look at our orders_processed metric. Prometheus is happy to tell us that one of the instances has processed ~7000 orders so far. 
What insights can we get from this number? Actually, not that much. For example, it would be more interesting to know how many orders did we processed recently. Here we calculate the increase in the number of processed orders during the last 5 minutes. 
This number could shed some light on the health of our application if we knew how many orders we expected to process under normal conditions. Let's compare it with some reference point in the past: let's imagine that we just deployed a nightly build of our application, and two hours ago we were running a thoroughly tested stable version.Modifier offsetchanges the time offset for the vector in the query: 
Currently, we have roughly the same increase in the number of orders as 2 hours ago: therefore, we can assume that our new build didn't break anything (yet). What is our current rate of order processing? 
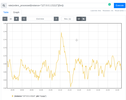
We processed 197 orders during the last 5 minutes, therefore the per-second average rate of increase is calculated as 197 orders / 5 * 60 seconds and is equal to ~0.7 orders per second. Prometheus has in-build function rate for this purpose:
As you can see from the graphs rate and increase are basically reveals the same pattern.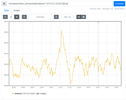
Now, how can we calculate the total rate of order processing for all instances of the application? We need to sum the rates of all instances: 
However, if we try to sum rates of different instances we get Empty query result. This happens because before the application of a binary operation Prometheus selects time series that have exactly the same set of labels from the left and right operands. In our case, Prometheus didn't find matching time series due to the difference in instance label. We can use on keyword to specify that we only want to match by job label (and effectively ignore the difference in instance label)
Or we can use ignoring keyword to explicitly ignore instance label:
What happens if we have ten instances of our application instead of two? Especially, taking into consideration that Kubernetes is free to kill any instance at any time, and spin up a new one. Prometheus offers aggregate functions that relieve us from the manual bookkeeping: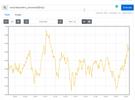
Note, that we applied aggregate operaion sum to rate function and not vise versa. We always take rate first and then apply the aggregation; otherwise, rate cannot detect counters restarts when the application restarts. As Robust Perception Blog puts it:
The only mathematical operations you can safely directly apply to a counter's values are rate, irate, increase, and resets. Anything else will cause you problems.
orders_processed is a rather generic metric; it could possibly have another label application that partitions it by different applications. In this case query sum(rate(orders_processed[5m])) returns the total rate for all applications which would be rather useless. We calculate the rate per application by using by keyword: sum by (application) (rate(orders_processed[5m])).We can check a potential memory leak by comparing the current total number of goroutines for the application with the total number of goroutines recorded an hour ago:
sum(rate(go_goroutines[5m] offset 1h)) /
sum(rate(go_goroutines[5m]))
SLO-related queriesAPI Errors RateLet's say we have counter http_requests_total that tracks the number of the received requests and has label status_code.We can determine the rate for the failed requests due to server errors:
rate(http_requests_total{status_code=~"5.*"}[5m])
We calculate the error ratio by dividing the rate of failed request on the total rate:
sum(rate(http_requests_total{status_code=~"5.*"}[5m])
/ sum(rate(http_requests_total[5m])
Finally, we can check whether the proportion of failed API requests is larger than 10%
sum(rate(http_requests_total{status_code=~"5.*"}[5m])) /
sum(rate(http_requests_total[5m]))
> 0.1
Request LatencyAnother metric response_latency_ms tracks the latency of the API responses in ms. We can check whether 95% of the responses take less or equal than 5 seconds.
histogram_quantile(
0.95,
sum(rate(request_latency_ms_bucket[5m])) by (le)
) / 1e3 > 5
le (less or equal) - is a required label that denotes an inclusive upper limit for the bucket, in our case 0.95-quantile. We divide the query result by 1e3 (1000) to convert from milliseconds to seconds.ConclusionAs we can Prometheus is a powerful and flexible tool. This article covers its usage from basic instrumentation of a Go application to SLO-related PromQl queries.
===========
Источник:
habr.com
===========
Похожие новости:
- [Разработка веб-сайтов, JavaScript, Программирование] Углублённое руководство по JavaScript: генераторы. Часть 1, основы (перевод)
- [Программирование, C++, Учебный процесс в IT, Карьера в IT-индустрии] C++ в Практикуме. Как обучить студентов плюсам, не отпугивая
- [Программирование, Java, Конференции, DevOps] Как работать с легаси, разгонять Java до скоростей C++ и мигрировать в облака: узнаем в четверг
- [Программирование, C++, Работа с 3D-графикой, Разработка игр, CGI (графика)] Vulkan. Руководство разработчика. Window surface (перевод)
- [Разработка веб-сайтов, Программирование, Учебный процесс в IT, DevOps] Анонс интенсива «Docker для разработчиков»
- [Мессенджеры, Законодательство в IT] «Коалиция за безопасный интернет» требует удалить Telegram из Google Play
- [Работа с видео, Разработка под Android, Софт] Видеоплеер заблокировали в Google Play за поддержку субтитров ASS
- [JavaScript, Node.JS, MongoDB, TypeScript] Практическое знакомство с Deno: разрабатываем REST API + MongoDB + Linux
- [Законодательство в IT, IT-компании] Работники Google запустили международный профсоюз Alpha Global
- [JavaScript, Google Chrome, Тестирование веб-сервисов] Автогенерация тестов на Puppeteer встроена в Chrome DevTools
Теги для поиска: #_programmirovanie (Программирование), #_go, #_devops, #_go, #_prometheus, #_metrics, #_devops, #_deployment, #_programmirovanie (
Программирование
), #_go, #_devops
Вы не можете начинать темы
Вы не можете отвечать на сообщения
Вы не можете редактировать свои сообщения
Вы не можете удалять свои сообщения
Вы не можете голосовать в опросах
Вы не можете прикреплять файлы к сообщениям
Вы не можете скачивать файлы
Текущее время: 14-Дек 21:23
Часовой пояс: UTC + 5
| Автор | Сообщение |
|---|---|
|
news_bot ®
Стаж: 7 лет 10 месяцев |
|
|
A Gentle Intro  All Prometheus metrics are based on time series - streams of timestamped values belonging to the same metric. Each time series is uniquely identified by its metric name and optional key-value pairs called labels. The metric name specifies some characteristics of the measured system, such as http_requests_total - the total number of received HTTP requests. In practice, you often will be interested in some subset of the values of a metric, for example, in the number of requests received by a particular endpoint; and here is where the labels come in handy. We can partition a metric by adding endpoint label and see the statics for a particular endpoint: http_requests_total{endpoint="api/status"}. Every metric has two automatically created labels: job_name and instance. We see their roles in the next section.Prometheus provides a functional query language called PromQL. The result of the query might be evaluated to one of four types:
 If that would be the case, then a Range Vector for a single time series "downgrades" to an Instant Vector. However, that's not the case: the difference between a Range Vector and an Instant Vector is not in the number of tracked time series but in the relation between a value of the metric and the corresponding timestamp. In Instant Vector a time series has a single value at the timestamp, in Range Vector a time series has an arbitrary number of values between two timestamps. Therefore, we can more accurately visualize a Range Vector in the following form:  The difference between an instant vector and a range vector will be more clearly seen in the action: let's instrument a Go application and see how can Prometheus help us with insights.A Counter is a metric that only goes up, for example, a number of the incoming HTTP requests.A Gauge is a metric that can have an arbitrary float value, for example, current CPU usage.A Histogram summarizes observations into statistical buckets, for example, we can track an API's response times. Why would one need a histogram and can't just measure the average response time? This is because we are not always interested in the average response times only. Let's say we have an SLO and 95% of the requests should take no longer than 300 ms. We need to single out all requests that took 300 ms or less, count their amount, and divide it by the total number of the request. To do so in Prometheus, we configure a histogram to have a bucket with an upper limit of 0.3 seconds for a response. Later we see how can we configure an alert if we fail to comply with the SLO.There is also a Summary, however it is left mostly for historical reasons and serves the same purpose as a histogram.Instrumenting a Go applicationLet's start without a Prometheus server. package main
import ( "net/http" "github.com/prometheus/client_golang/prometheus/promhttp" ) func main() { http.Handle("/metrics", promhttp.Handler()) http.ListenAndServe(":2112", nil) } http localhost:2112/metrics
# HELP go_gc_duration_seconds A summary of the pause duration of garbage collection cycles.
# TYPE go_gc_duration_seconds summary go_gc_duration_seconds{quantile="0"} 0 go_gc_duration_seconds{quantile="0.25"} 0 go_gc_duration_seconds{quantile="0.5"} 0 go_gc_duration_seconds{quantile="0.75"} 0 go_gc_duration_seconds{quantile="1"} 0 go_gc_duration_seconds_sum 0 go_gc_duration_seconds_count 0 # HELP go_goroutines Number of goroutines that currently exist. # TYPE go_goroutines gauge go_goroutines 8 # HELP go_info Information about the Go environment. # TYPE go_info gauge go_info{version="go1.15.5"} 1 # HELP go_memstats_alloc_bytes Number of bytes allocated and still in use. # TYPE go_memstats_alloc_bytes gauge [truncated] # HELP go_goroutines Number of goroutines that currently exist.
# TYPE go_goroutines gauge go_goroutines 7 promhttp_metric_handler_requests_total{code="200"} 1
promhttp_metric_handler_requests_total{code="500"} 0 promhttp_metric_handler_requests_total{code="503"} 0 package main
import ( "net/http" "time" "github.com/prometheus/client_golang/prometheus" "github.com/prometheus/client_golang/prometheus/promauto" "github.com/prometheus/client_golang/prometheus/promhttp" ) var counter = promauto.NewCounter(prometheus.CounterOpts{ Name: "orders_processed", }) func main() { go func() { for { counter.Inc() // simulate some processing function time.Sleep(time.Second) } }() http.Handle("/metrics", promhttp.Handler()) http.ListenAndServe(":2112", nil) } http localhost:2112/metrics | grep orders_processed
# HELP orders_processed
# TYPE orders_processed counter orders_processed 7 # HELP orders_processed
# TYPE orders_processed counter orders_processed 10 scrape_configs:
- job_name: myapp scrape_interval: 10s static_configs: - targets: - 127.0.0.1:2112 docker run \
--network "host" \ -p 9090:9090 \ -v $HOME/GolandProjects/go-learn/prometheus/prometheus.yml:/etc/prometheus/prometheus.yml \ prom/prometheus  How many goroutines do we have? In a table view we see the last recorded value:  And in a table view we can see the trend:  The result of this query (go_goroutines) is an instant vector that contains a single time series. What will be the result for the same query when we run a second instance of our application? Then instance label will have two possible values for two instances, therefore we get two time series. And as noted above we still have an instant vector, not a range vector. Let's add one more target to our configuration and start the second instance of our application at port 21112. scrape_configs:
- job_name: myapp scrape_interval: 10s static_configs: - targets: - 127.0.0.1:2112 - 127.0.0.1:21112  If we provide a time range we get a range vector:  In this case, we requested a range of values between two timestamps: now and five minutes in the past with a step equal to 1 minute. In the output, symbol @separates a value of a metric from its timestamp.Neither Prometheus no Grafana can picture the graph for a range vector. However, all function that takes a range vector as input returns an instant vector which in turn can be pictured. Prometheus Functions and ModifiersThe two most useful range functions are increase and rate; both of them should be used only with counters. Let's have a look at our orders_processed metric. Prometheus is happy to tell us that one of the instances has processed ~7000 orders so far.  What insights can we get from this number? Actually, not that much. For example, it would be more interesting to know how many orders did we processed recently. Here we calculate the increase in the number of processed orders during the last 5 minutes.  This number could shed some light on the health of our application if we knew how many orders we expected to process under normal conditions. Let's compare it with some reference point in the past: let's imagine that we just deployed a nightly build of our application, and two hours ago we were running a thoroughly tested stable version.Modifier offsetchanges the time offset for the vector in the query:  Currently, we have roughly the same increase in the number of orders as 2 hours ago: therefore, we can assume that our new build didn't break anything (yet). What is our current rate of order processing?  We processed 197 orders during the last 5 minutes, therefore the per-second average rate of increase is calculated as 197 orders / 5 * 60 seconds and is equal to ~0.7 orders per second. Prometheus has in-build function rate for this purpose:  As you can see from the graphs rate and increase are basically reveals the same pattern.   Now, how can we calculate the total rate of order processing for all instances of the application? We need to sum the rates of all instances:  However, if we try to sum rates of different instances we get Empty query result. This happens because before the application of a binary operation Prometheus selects time series that have exactly the same set of labels from the left and right operands. In our case, Prometheus didn't find matching time series due to the difference in instance label. We can use on keyword to specify that we only want to match by job label (and effectively ignore the difference in instance label)  Or we can use ignoring keyword to explicitly ignore instance label:  What happens if we have ten instances of our application instead of two? Especially, taking into consideration that Kubernetes is free to kill any instance at any time, and spin up a new one. Prometheus offers aggregate functions that relieve us from the manual bookkeeping:  Note, that we applied aggregate operaion sum to rate function and not vise versa. We always take rate first and then apply the aggregation; otherwise, rate cannot detect counters restarts when the application restarts. As Robust Perception Blog puts it: The only mathematical operations you can safely directly apply to a counter's values are rate, irate, increase, and resets. Anything else will cause you problems.
sum(rate(go_goroutines[5m] offset 1h)) /
sum(rate(go_goroutines[5m])) rate(http_requests_total{status_code=~"5.*"}[5m])
sum(rate(http_requests_total{status_code=~"5.*"}[5m])
/ sum(rate(http_requests_total[5m]) sum(rate(http_requests_total{status_code=~"5.*"}[5m])) /
sum(rate(http_requests_total[5m])) > 0.1 histogram_quantile(
0.95, sum(rate(request_latency_ms_bucket[5m])) by (le) ) / 1e3 > 5 =========== Источник: habr.com =========== Похожие новости:
Программирование ), #_go, #_devops |
|
Вы не можете начинать темы
Вы не можете отвечать на сообщения
Вы не можете редактировать свои сообщения
Вы не можете удалять свои сообщения
Вы не можете голосовать в опросах
Вы не можете прикреплять файлы к сообщениям
Вы не можете скачивать файлы
Вы не можете отвечать на сообщения
Вы не можете редактировать свои сообщения
Вы не можете удалять свои сообщения
Вы не можете голосовать в опросах
Вы не можете прикреплять файлы к сообщениям
Вы не можете скачивать файлы
Текущее время: 14-Дек 21:23
Часовой пояс: UTC + 5
